GRL:Vanishing Glaciers at Southeast Tibetan Plateau Have Not Offset the Declining Runoff at Yarlung Zangbo
Data:https://doi.org/10.5281/zenodo.3711154.
DOI:http://dx.doi.org/10.1029/2021GL094651
Abstract
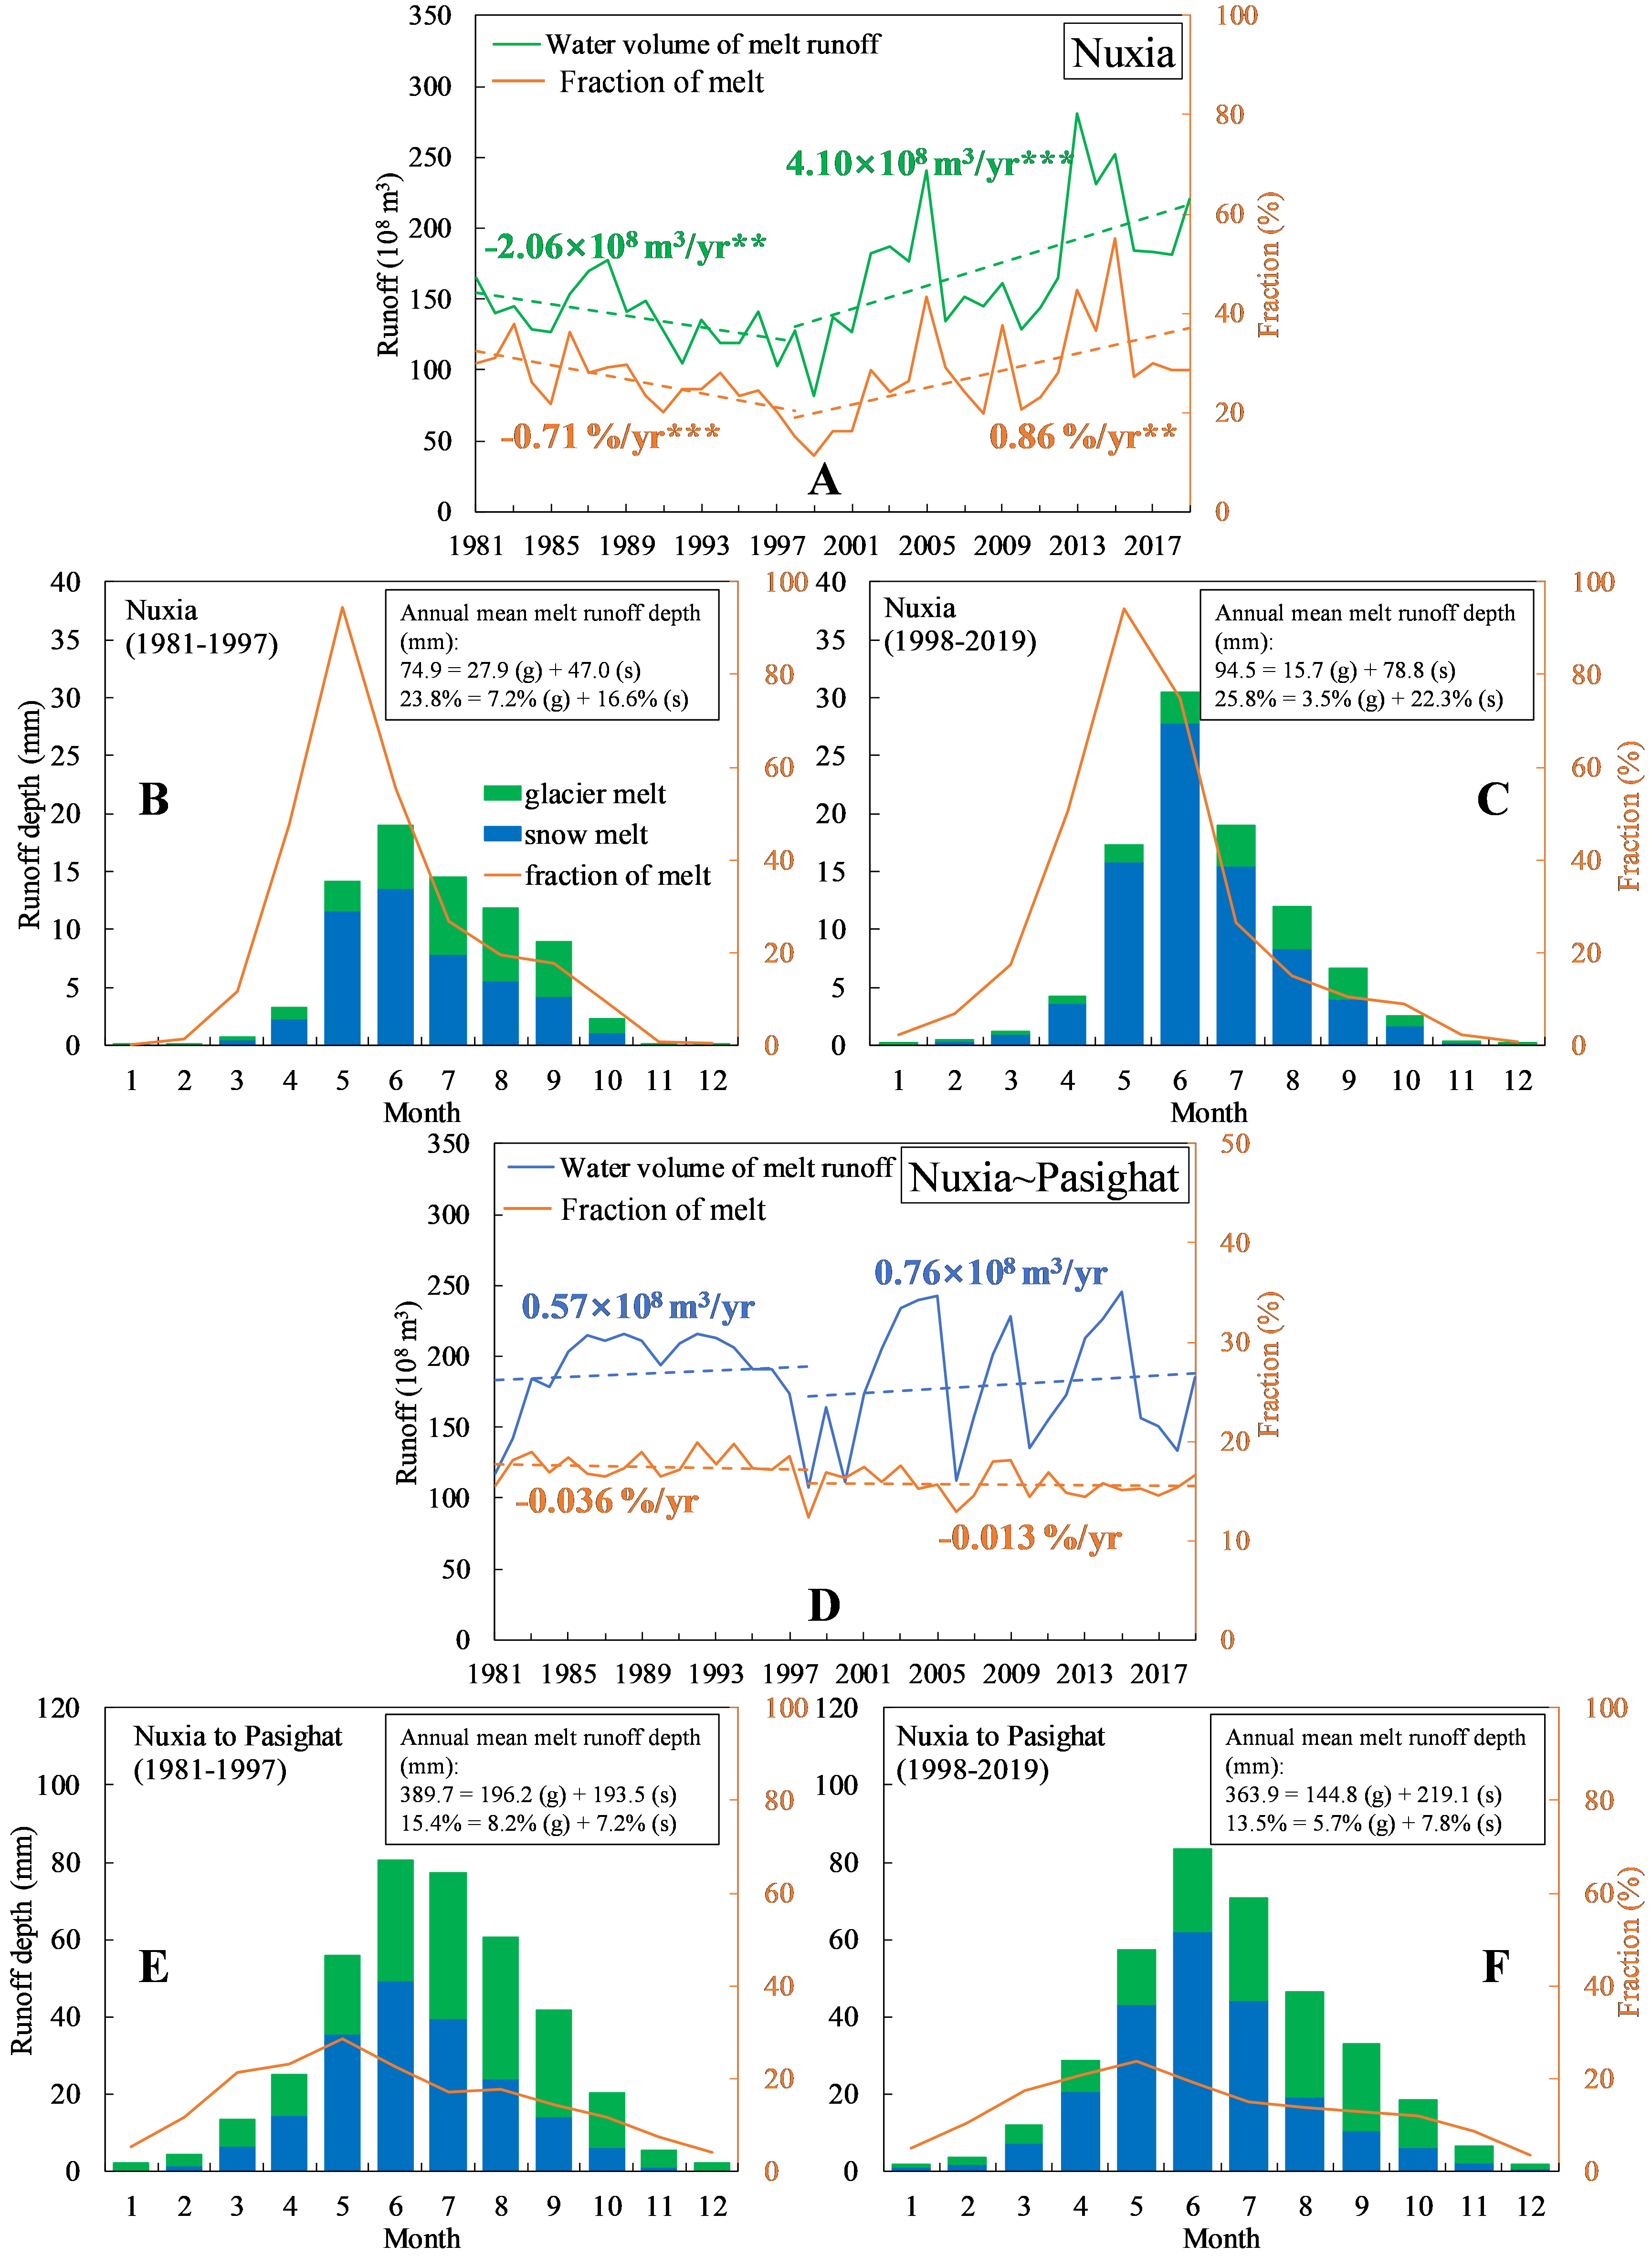
The Third Pole experiences accelerated glacier retreating particularly in the eastern-Himalaya, coinciding with a decrease of monsoon-precipitation in the early 21st century. The extent to which the vanishing abundant maritime glaciers buffer the declining precipitation-runoff remains unclear. Here, with a state-of-the-art enthalpy-based distributed cryosphere-hydrology model and first-hand hydrometeorology observations at Motuo (latest accessible Chinese county), we carefully examine the Yarlung Zangbo basin along Himalayas. We find that during 1998–2019, the rising downstream runoff (lower Nuxia; +6.40 × 10⁸ m3/yr) offsets the dropping upstream runoff (upper Nuxia; −6.89 × 10⁸ m3/yr); however, only the marginal contribution from the vanishing eastern-Himalaya and Nyainqêntanglha glaciers. During 1998–2019, dry upstream illustrates limited glacier melt (15.7 mm/yr) with dominated snow melt (78.8 mm/yr); while much larger at humid downstream (144.8 mm/yr for glacier melt and 219.1 mm/yr for snow melt). From 1981 to 2019, we observe glacier-to-snow melt transition in both upstream and downstream due to glacier degradation and growing nonmonsoon-season precipitation.
Key Points
There is the largest fraction and retreat speed of glaciers in upper Brahmaputra (Yarlung Zangbo) among large rivers from Tibetan Plateau
Rising downstream runoff offsets the dropping upstream runoff with marginal contribution from vanishing southeast Tibetan Plateau glaciers
Glacier-to-snow melt transition in both upstream and downstream due to glacier degradation and growing nonmonsoon-season precipitation
Plain Language Summary
The extent to which the vanishing abundant maritime glaciers buffer the declining precipitation-runoff in the upstream of upper Brahmaputra basin (UBB) remains unclear. Here we use a distributed cryosphere-hydrology model to study the hydrological regimes of the UBB, in conjunction with our own in situ water level observations (first-hand hydrometeorology observations at the latest accessible Chinese county Motuo). We find contrasting discharge trends between the upstream (decreasing) and downstream (increasing) after 1998, and explain the underlying causes. In contrast with continental glaciers, Himalaya and Nyainqêntanglha glaciers feeding the Brahmaputra headwaters do not provide a significant contribution to total annual discharge. This is primarily because the abundant monsoon-precipitation coincides with the warmest temperatures at higher altitudes, and the contribution from glacier melt is then insignificant compared to the water volume generated by rainfall.
Fig 1. Location of the Upper Brahmaputra Basin (UBB), which originates from the Tibetan Plateau (TP), and the spatial distribution of discharge gauges and meteorological stations in the basin. (a) Five large rivers originate from the TP with corresponding glaciers fraction shown by the values in the bracket (Immerzeel et al., 2010) and mass balance presented by the red circle (Yao et al., 2012). There is the largest fraction and retreat speed of glacier in UBB. (b) Spatial distribution of discharge gauges and meteorological stations in the basin. Glaciers are mainly located in downstream. Trends of annual precipitation from six stations reveal the pattern that precipitations first increase then decrease with the turning point at 1998. We define the catchment above Nuxia station as the upstream, and the area between Nuxia and Pasighat as the downstream, divided by the black curve.
Fig 5. Comparison of different fraction of melt water in the upstream and downstream. (a–c) Annual variation of meltwater, and monthly glacier melt and snow melt with corresponding fractions at the upstream. (d–f) The same but for the downstream. (g) means glacier melt and (s) indicates snow melt. * indicates the significance level p < 0.1, ** indicates p < 0.05, and *** represents p < 0.01.


