JH-Regional Studies: Energy-balance modeling of heterogeneous glacio-hydrological regimes at upper Indus

2024-02-23 22:50:25 6

DOI:https://doi.org/10.1016/j.ejrh.2023.101515  
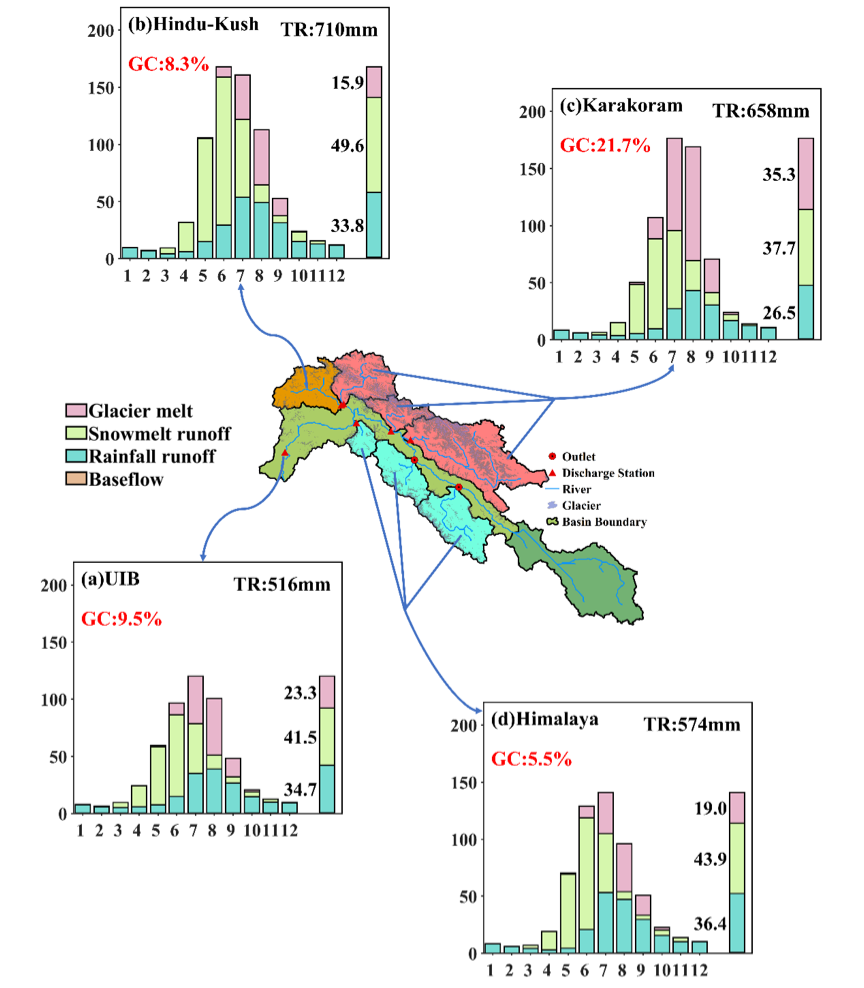
Highlights

  • • Energy-balance modeling of heterogeneous glacio-hydrological regimes at upper Indus.

  • • Contribution of glacier to runoff was largest at Karakoram but least at Hindu Kush.

  • • We show solar radiations are important for glacier-flood peak and time simulations.

Abstract

Study region

The Upper Indus River Basin (UIB).

Study focus

The UIB has experienced marked runoff change due to the accelerated glacier melting under climate warming. Nonetheless, the glacio-hydrological regime in the UIB remains unclear due to considerable uncertainties in precipitation data and glacio-hydrology modeling. Here, we used a state-of-the-art water and energy budget-based distributed glacio-hydrology model (WEB-DHM-S) that employed an energy-balance glacier module for both clean and debris-covered glaciers to analyze the hydrological regimes within the UIB during 2001–2020, particularly the spatial heterogeneity among the Himalaya-Karakoram-Hindu-Kush mountains.

New hydrological insights for the region

Results indicated that the high-resolution ERA5-Land precipitation data showed the most reliable estimate (∼750 mm/yr) among available products, which was the model’s forcing data. Our results showed that the mean contributions of snow, glaciers, rainfall, and baseflow to total runoff in the UIB were 41.5%, 23.3%, 34.7%, and 0.5%, respectively. Glacial melting made the largest contribution to total runoff in the Karakoram (35.3%), while the smallest contribution was made in the Hindu Kush (15.9%). Further, we showed that glacial melting was highly sensitive to changes in air temperature and solar radiation inputs. In particular, fluctuating solar radiation could change the magnitude and timing of annual flood peaks in ice melting, which emphasized the crucial role of energy-related forcing data (besides the traditional precipitation and air temperature inputs) in glacio-hydrology modeling.


Fig. 6The seasonal cycles of discharge contributed by glacier melt runoff, snowmelt runoff, rainfall runoff, and baseflow in the UIB at Besham station (a) and its three mountainous regions (b-d, Hindu-Kush, Karakoram, and Himalaya, respectively). The right aside stacked bar plot shows the average annual components of the discharge. The red words show the glacier coverage (GC), and the TR represents the total runoff of each region.
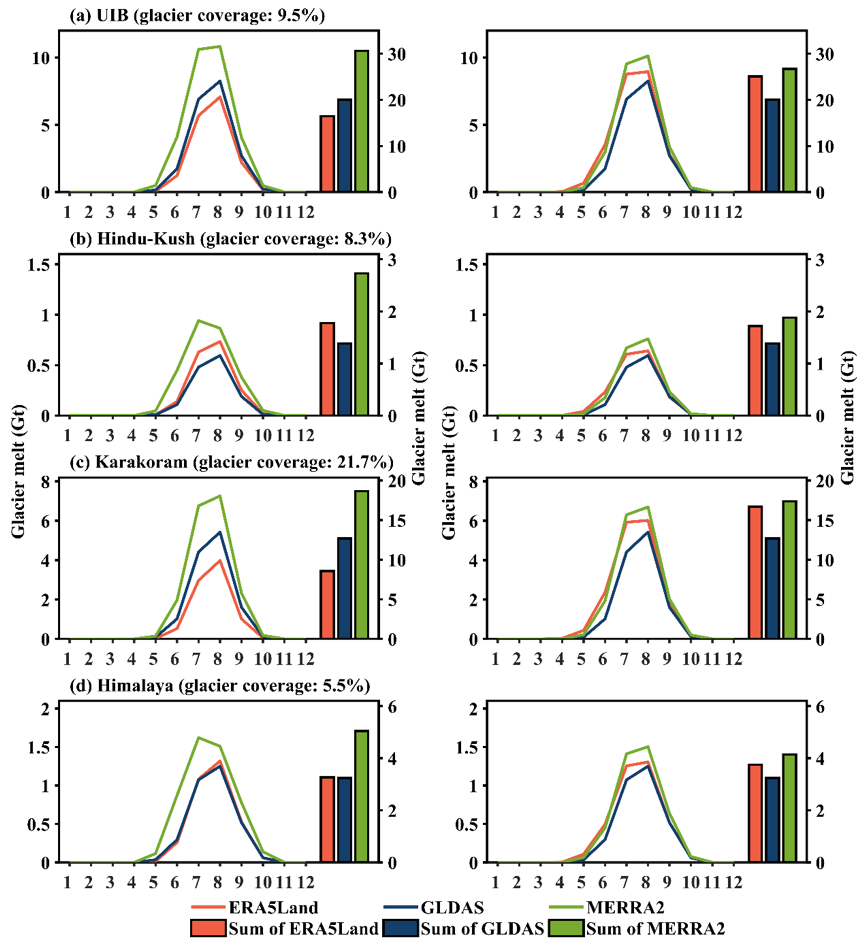


Fig. 11The comparison of simulated monthly glacier melt with three different air temperature (left) and solar radiation inputs (right) at UIB (a) and its three mountainous regions (b-d). The right bar plot shows the sum of glacier melt during 2001–2020.